The Impact of Minimums: A Little, or a Lot?
A new working paper analyzes an oft-forgotten aspect of land-use policy: The impact on affordability of minimum lot sizes, which cities use to set the smallest allowable square footage for individual parcels of land. This seemingly minor detail can have a huge impact on spatial segregation and economic inequality, as Amrita Kulka of the University of Wisconsin-Madison finds.
Kulka (2020) poses a simple yet powerful hypothesis: “By imposing different housing consumption floors across neighborhoods, minimum lot sizes can potentially distort the location decisions of households.”
Key findings:
- Higher minimum lot sizes result in higher-income neighborhoods. Specifically, data from Wake County, NC showed that “a decrease in the allowed density by one dwelling unit per acre implies an increase in average neighborhood income by 4.5%”
- Neighborhoods that mandate larger lots also see higher house prices. On average, the study finds “lots are 19% larger and houses 7.5% more expensive on the more regulated side of a minimum lot size boundary.”
- Big lots are themselves a luxury amenity. By modeling households’ neighborhood choices, the paper estimates that relaxed minimum lot standards (allowing more homes per acre) would open up high-amenity neighborhoods to middle class residents.
A large body of research examines land-use regulations and their impact on segregation in California. So far, most research has focused on zoned capacity, the permitting process, or the overall stringency of regulations contributing to racial and class segregation. The evidence on permitted homes per parcel is clear, but Kulka (2020) studies a particularly powerful variable: permitted lots per acre, or minimum lot sizes.
Kulka focuses on Wake County in North Carolina, home to the Raleigh-Durham metropolitan area. This region, not unlike some in California, is undergoing a devastating housing crisis exacerbated by longstanding patterns of racial segregation. Not coincidentally, it also ranks higher than the average US city on the Wharton Residential Land Use Index (WRLUI), a measure of land-use regulation stringency. Kulka compiles data from Zillow and public mortgage data from the region to compare race and income factors with lot sizes, and comparing actual lot sizes with allowed minimum lot sizes.
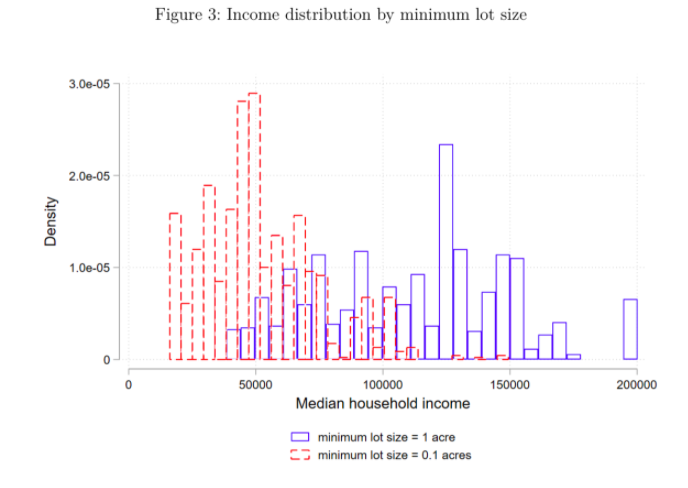
Comparing this evidence with Census data, Kulka finds that larger minimum lot sizes correlate strongly with higher incomes in Wake County. Here’s what that looks like:
Next, Kulka gathers administrative data from local public schools, including free and reduced lunches, to examine and model the effect of minimum lot sizes on neighborhood choices. Kulka uses a boundary discontinuity design to isolate the effect of lot sizes from other regulations and control for other factors that limit housing choices. “In the cleanest possible scenario,” Kulka explains, “I would compare two houses on either side of a street, where the regulation boundary coincides with a neighborhood street, i.e. the house on one side of the street is regulated with a higher minimum lot size/ lower density and the house on the other side is regulated less strictly with a lower minimum lot size/ higher density.” In lieu of such neat and perfectly controlled boundaries, other factors such as school attendance and amenities are also measured.
In rough summary, Kulka’s evidence does suggest that permitted density has a strong effect on household spatial sorting by income: “at a boundary where one side allows one dwelling unit per acre less than the other, sorting on income is about $4,000.” The average amount a household borrows for a mortgage also increases by 3% at this boundary.
What if, all else equal, minimum lot standards were relaxed, allowing for more homes per acre? Of course, “all else equal” sets a high evidentiary standard for social scientists. But with all these variables in play, Kulka is able to model several counterfactuals.
Kulka sets up a static neighborhood choice model to estimate households’ living choices based on “land consumption,” or the size of the lot they choose, and consumption of other amenities, as their budget may allow. “While this behavior does not correspond to the reality,” Kulka explains, “it approximates the behavior of a household with children picking a neighborhood to live in for the duration of their children’s school education.”
The results from Kulka’s county-level analysis mirror the modeling closely: a larger fraction of households earning below median income tend to prefer neighborhoods with smaller lot sizes. Here’s what that looks like:

Kulka simulates two counterfactuals: reductions in minimum lot sizes, and vacant land zoned for residential neighborhoods. In both of these simulations, the results suggest “that small, localized reductions in the minimum lot size can lead to desirable neighborhoods being more affordable to lower income households that value amenities highly” and, furthermore, “that the affordability of vacant land will depend on the minimum lot size relative to the available amount of land that is to be zoned.”
Specifically, households earning the county’s median annual income of $75,000 value high-amenity neighborhoods and will spend more to live in them if minimum lot sizes are reduced to make homes more affordable there. Affluent neighborhoods with high-quality amenities such as schools and parks could see more socioeconomic integration if they try this one weird trick.