Maps
California YIMBY mapping research
Newest Maps
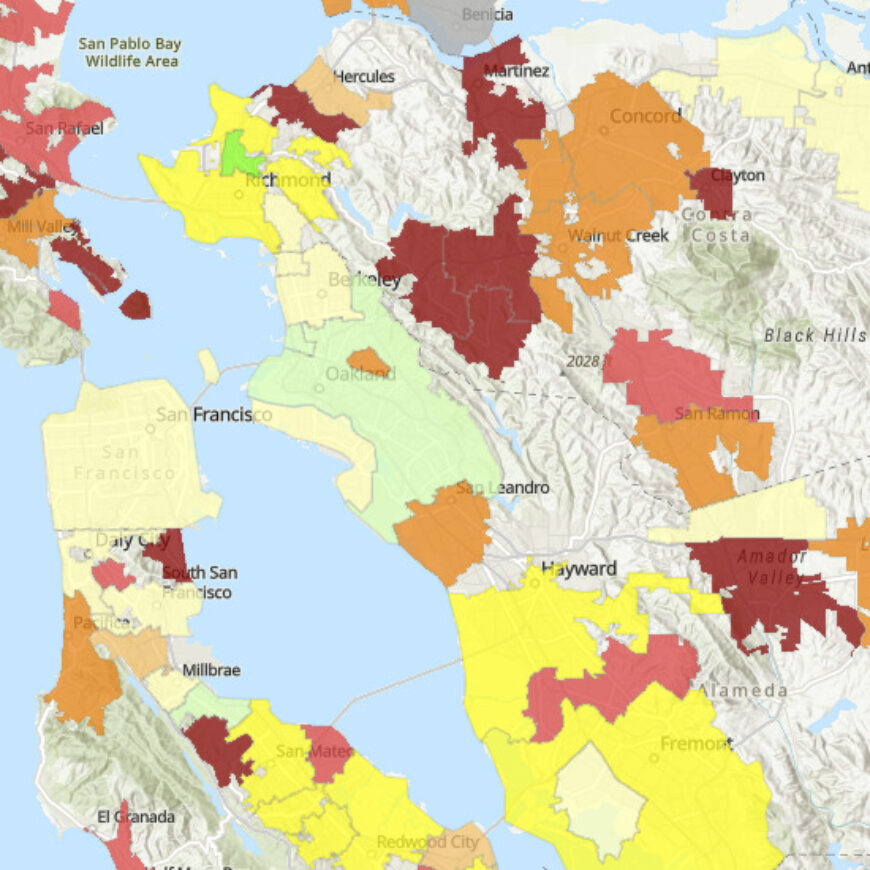
Housing Underproduction in California 2023
This companion map to the Housing Underproduction in California 2023 report shows relative housing underproduction rates across the state.

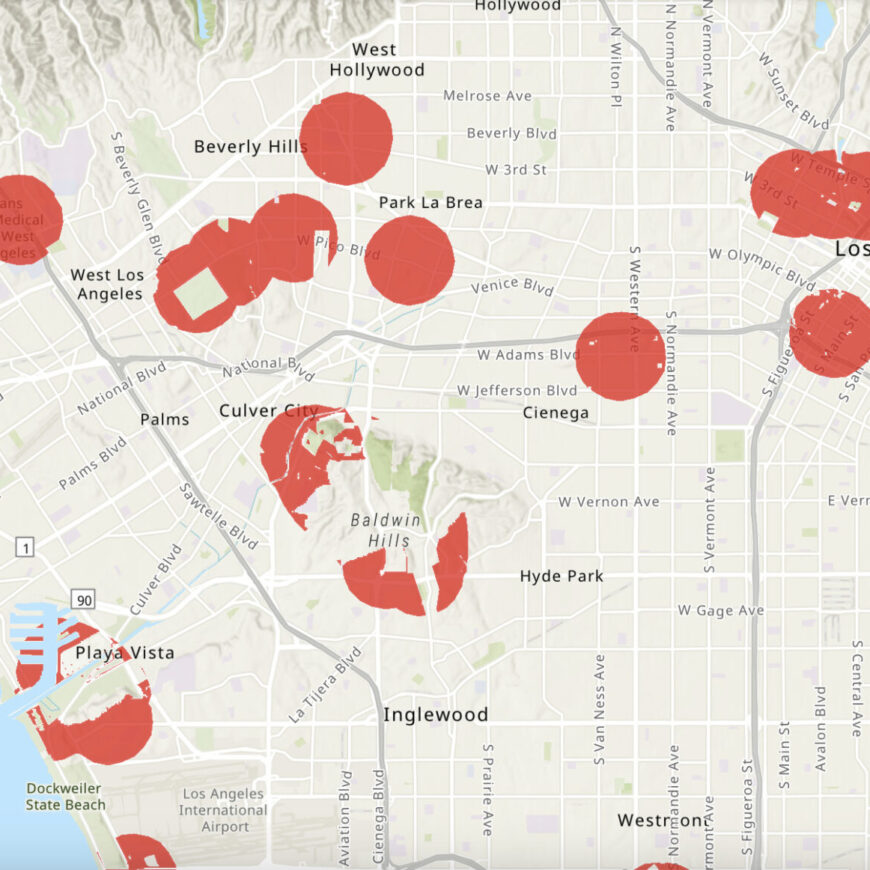
Active Oil Wells: 3,200 Foot Buffer
This is a map of areas of the state that won’t be eligible for SB 4 owing to the additional exclusion of areas within a 3,200-feet of an active oil well—an exclusion added to the bill by the Assembly Natural Resources Committee.

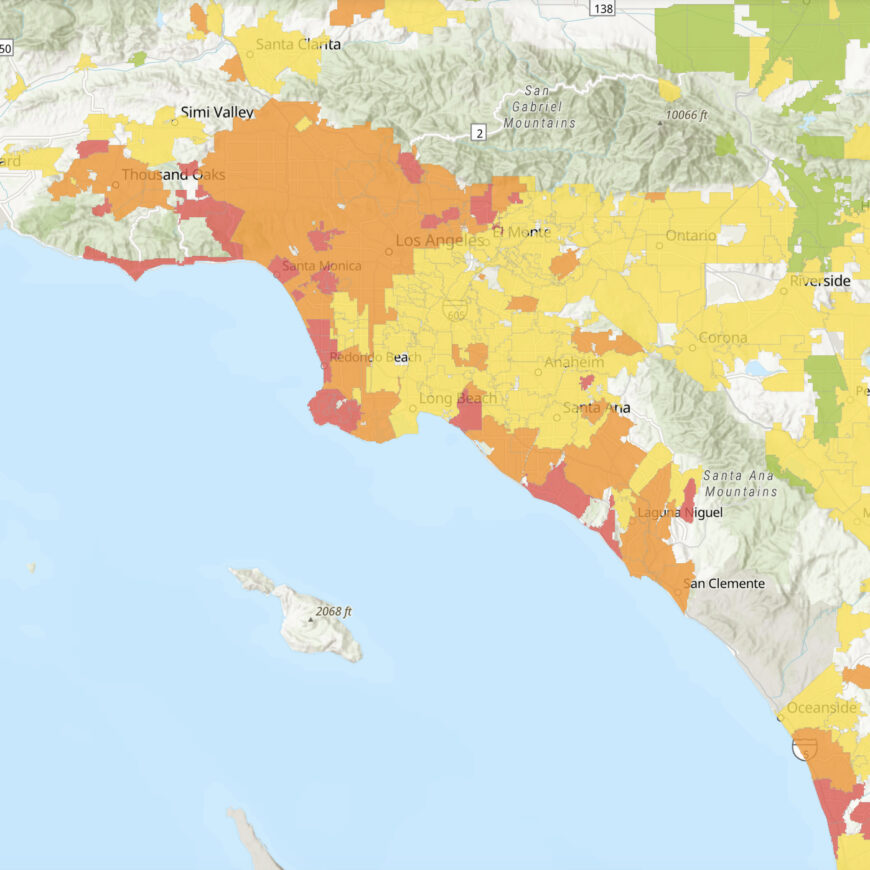
California Home Price-to-Income Ratio Map
This map shows the ratio of local median home prices to metropolitan median household incomes for every jurisdiction in California.

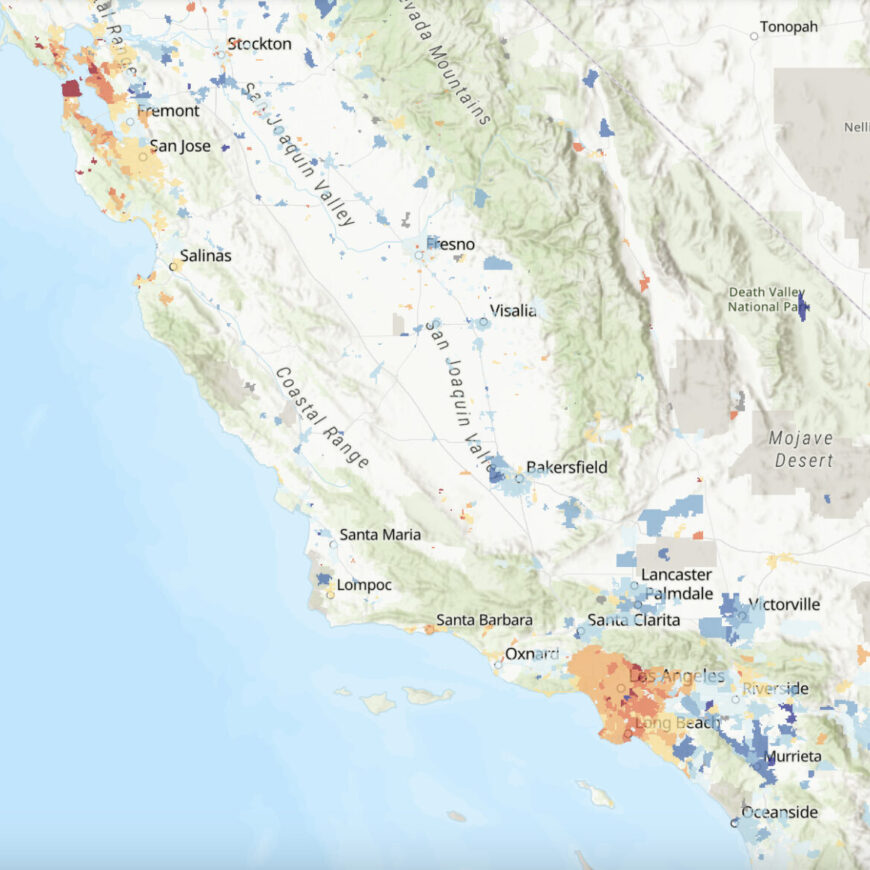
Median Age of Housing in California
The median home in California was built in 1976, meaning that the typical home is nearly 50 years old. But how does this vary across the state? Using US Census data, we can tell which parts of the state have the oldest and newest housing stock.
