More Homes: Illegal in 96% of California
“How much of California’s residential land is zoned exclusively for single family homes?” is a fairly straightforward question that is surprisingly difficult to answer – because state-level data on zoning largely does not exist.
Until now. In Single-Family Zoning in California: A Statewide Analysis, Stephen Menendian, Shahan Shahid Nawaz, and Samir Gambhir publish the results of their painstaking effort to assemble data on every city in the state.
Key Takeaways:
- 96% of residential land area in California is zoned single-family only.
- 91 California jurisdictions reserve 95% or more of their land for single family homes only.
- Jurisdictions with more single-family zoning have fewer nonwhite residents: cities that reserve more than 95% of their residential land for single family homes were twenty percentage points whiter than the state at large.
As noted earlier, the absence of good state-level data on zoning makes cross-jurisdiction comparisons very difficult. This is in part due to the structure of land use authority in California, which is delegated to 58 counties and 482 municipalities, each with its own unique, highly technical, and idiosyncratic zoning code.
As such, even a classification as simple as “R-1 Single Family Zoning” may describe wildly different land use regulations in different cities, or even within one jurisdiction: R1 zoning with a 40,000 square foot minimum lot size is much more restrictive than R1 with a 1,500 square foot minimum lot size.
Also, despite recent efforts to create one, there is no nationwide or even statewide zoning atlas (the researchers who worked on this report are contributing to the California effort).
To study patterns across the whole state, these researchers undertook what they describe as a “tedious and time-intensive effort” to assemble a statewide zoning data set by going through local zoning codes and sorting zoning designations into categories that included single-family residential, other residential (including multifamily and mixed use), and non-residential. Further, types of housing development were coded as either by-right or conditional, requiring special permits, then joined to a GIS shapefile to create hundreds of maps.
They found, unsurprisingly, that single family zoning covers a super-majority of California’s residential land: “across all jurisdictions in California, single-family-only zoning averages 77.82 percent of residential land in our analysis, with a median percentage of 83.93. When limiting our focus to incorporated areas only, single-family-only zoning averages 76.06 percent of residential land. For unincorporated areas, that figure is a much higher 95.95 percent, suggesting that county authorities with zoning power tend to be even more restrictive in exercising that authority than municipal leaders.”
Beyond this, they found a strong correlation between the restrictiveness of a city’s zoning and its racial demographics. Specifically, the more restrictive the city’s zoning, the fewer nonwhite people live there:
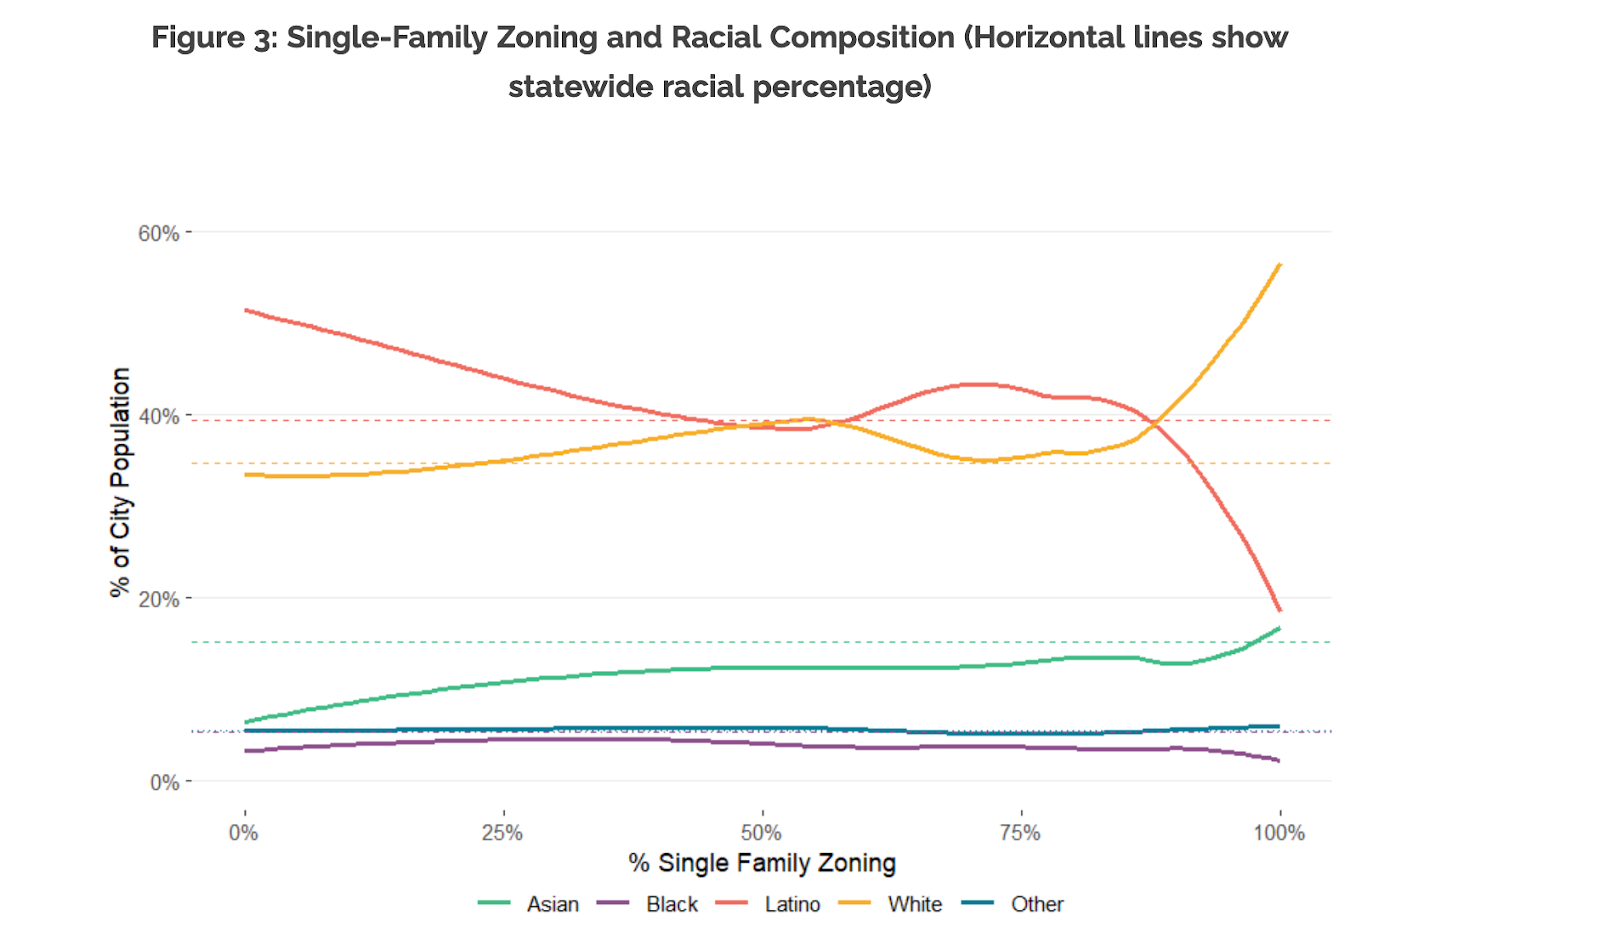
Additionally, zoning restrictiveness was strongly correlated with income, with more-restrictive jurisdictions having higher median incomes.
The researchers conclude with suggestions about how to use their data to target zoning reform efforts, recommending a focus on cities close to regional economic centers with high percentages of single family zoning, “high opportunity” designations on opportunity maps, and poor performance with RHNA targets.