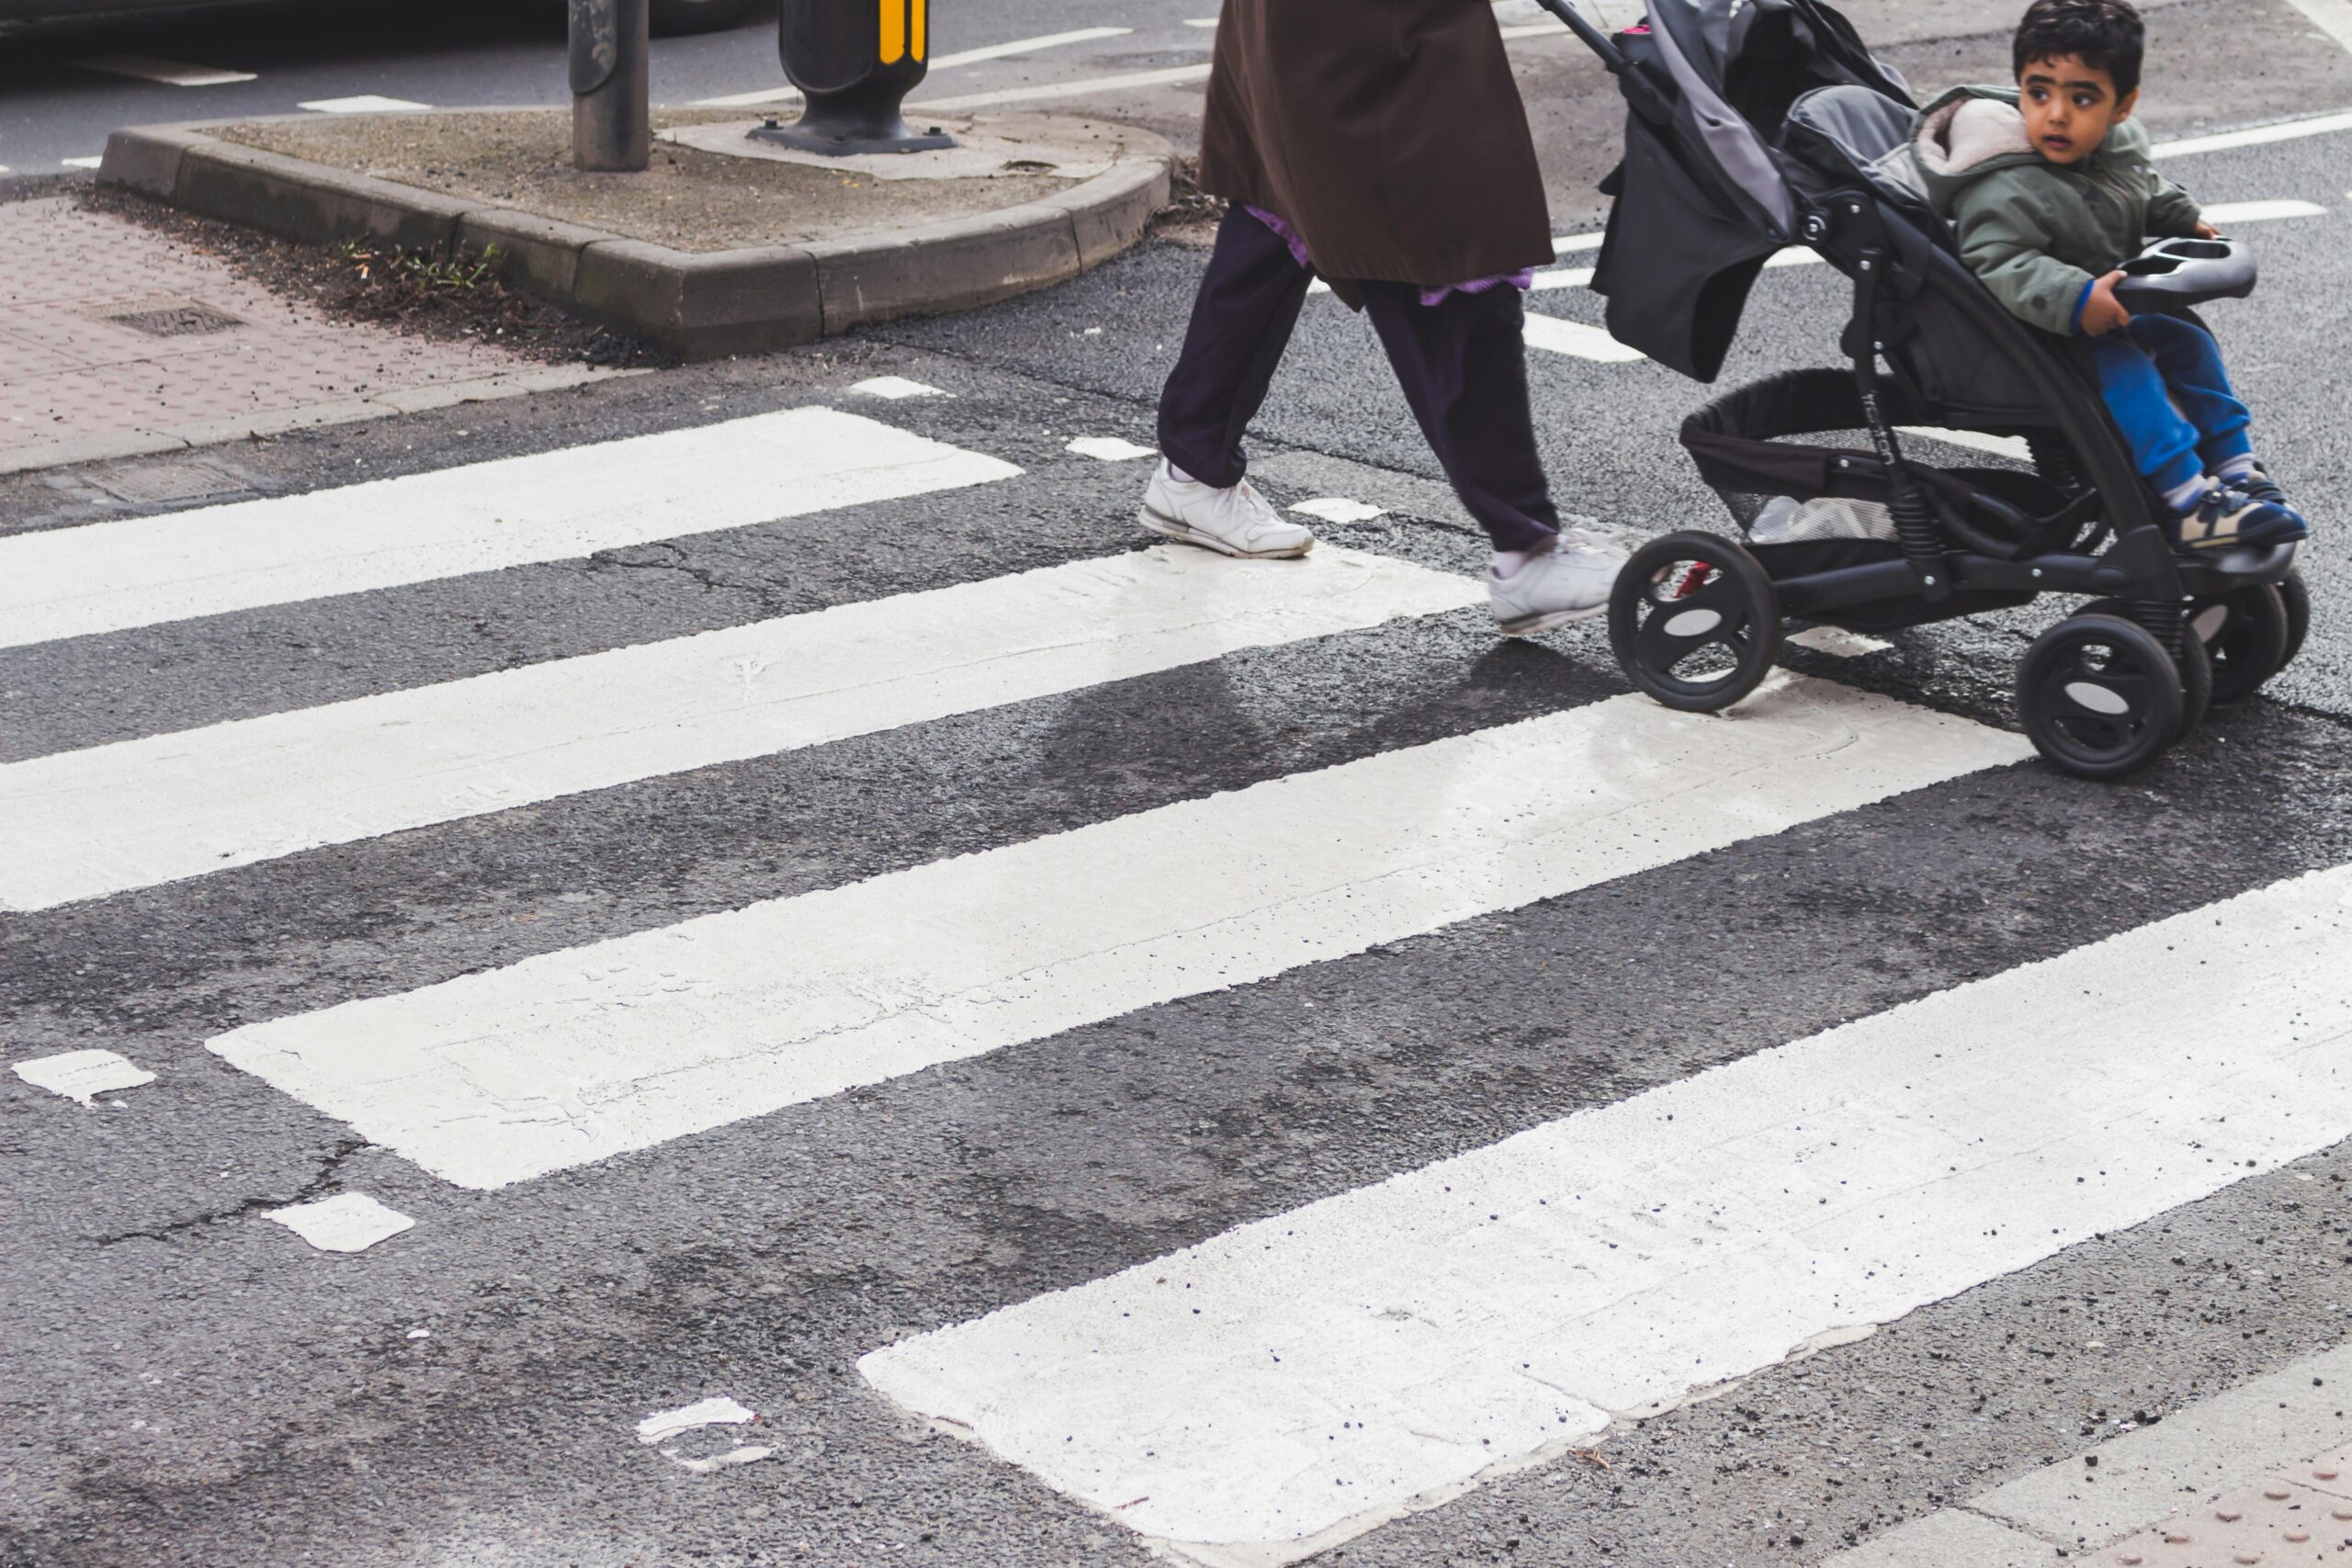
Detroit’s War Against Our Kids

The United States is in the midst of a traffic violence epidemic, with motor vehicle collisions among the leading causes of death for children, and annual traffic deaths reaching 16-year highs. The increasing share of SUVs on the road is a major driver of this deadly crisis.
Edwards & Lenard (2022) at the University of Illinois at Springfield find evidence that SUVs and pickup trucks have been significantly deadlier for pedestrians and cyclists than the average passenger vehicle since traffic fatalities began increasing in 2009.
Key takeaways:
- SUVs are eight times more likely to kill cyclist or pedestrian children in a collision than a passenger vehicle.
- Overall, SUVs are disproportionately deadly in collisions, accounting for less than 15 percent of all vehicle collisions with pedestrians and cyclists, but a full 25 percent of fatalities in those collisions.
- Motor vehicles are also disproportionately killing Black pedestrians and cyclists.
As automakers continue to manufacture and distribute a greater share of pickup trucks and large sport utility vehicles, their greater size, weight, and momentum than traditional passenger vehicles is leading to a statistically significant increase in the number of traffic-related deaths and severe injuries.
2021 was the worst year for traffic fatalities in the US since 2005, with a staggering 13 percent increase in pedestrian fatalities alone. By linking collision data with hospital records in Illinois, Edwards & Lenard (2022) show strong evidence that the American car industry’s two-decade-long focus on selling larger, heavier vehicles, with higher grilles and worse forward-view for drivers, bears major responsibility for the carnage.
The study takes three basic steps. First, “an analysis of the crash file alone to investigate the effect of vehicle type on pedestrian and pedalcyclist fatalities, as the crash file is considered the authoritative source for fatalities. The second half of the report employs only linked crash and hospital data, as this permits a higher fidelity investigation of bodily injury location, severity, and ultimately hospital charges.” Finally, “a logistic regression was performed to estimate the effects of vehicle type, road conditions, and victim demographics on the likelihood of a fatal pedestrian or pedalcyclist crash event occurring.” While the authors acknowledge that the basic model is “a blunt instrument,” the results were statistically significant.
The authors report: “Though SUVs were the striking vehicle in 14.7 percent of cases, they were involved in greater than one-in-four (25.4 percent) fatalities…Conversely, though passenger cars were the striking vehicle in 62 percent of cases, they were involved in just 38.4 percent of fatalities.”
Larger vehicles are even deadlier for smaller humans: “SUVs were the striking vehicle in greater than 40 percent of childhood fatalities, even though SUVs were involved in just 16.9 percent of childhood cases. Further, children represented 21 percent of all pedestrian and pedalcyclist crash victims but 26.1 percent of cases involving SUVs – implying SUVs were not only more deadly, but also disproportionately struck children.”
On the other hand, because SUVs are also taller, they were also found to disproportionately cause major head injuries in pedestrians and cyclists. By this metric, the authors estimate that “the typical pedestrian or pedalcyclist crash victim struck by a large motor vehicle could expect an additional $1,230 in median hospital charges compared to those struck by a passenger car; and an additional $4,380 in average hospital charges.”
The racial disparities in traffic violence are also pronounced. Since 2009, Black pedestrians and cyclists in Illinois were twice as likely to be killed by a motorist, especially outside of Chicago. This is consistent with nationwide disparities in traffic safety that are tracked annually in Smart Growth America’s Dangerous By Design series.
Like any good researchers, Edwards & Lenard offer a theory for patterns in the data, while encouraging further areas of study. The explanation, the authors conclude, “is likely a confluence of factors ranging from the physical (big vehicles) to the socioeconomic (more people walking during tough times) to the behavioral (feelings of security in a high-tech car that leads to speeding), as they commonly are in the social sciences.”
However, “research should also examine the neighborhoods and communities in which cases are found to be most frequent. Findings in this area would provide powerful insights into interventions that may be tailored to narrowly target the most at-risk populations.”
Photo by Dom J