Did Displacement Play a Role in California’s COVID-19 Surge?
For the past two months, Southern California was America’s COVID-19 epicenter. Throughout the month of January, someone in Los Angeles County died every six minutes from COVID-19 related complications. The pandemic ravaged the Los Angeles area to such a degree that air-quality restrictions on the number of cremations were lifted so that overwhelmed hospitals and funeral homes could clear the unprecedented backlog of cadavers.
While much has been written about the crowding, systemic racism and other conditions which led to the disease’s rapid spread throughout the greater LA region, what triggered the late-2020 wave in California remains a mystery. Some have speculated that it was a combination of colder weather, fatigue from months of lockdown or the emergence of a more transmissible coronavirus variant first spotted in the UK. Still, absent the types of robust contact-tracing systems found in other nations, the precise catalyst for California’s COVID surge will remain forever unknown.
I’d like to introduce another theory on what touched off the COVID-19 wildfire across California, but particularly in the southern part of the state. Decades of out-migration have effectively stretched California’s borders into those of neighboring states as families fleeing the high-cost of housing have sought greener pastures next door. While California’s strict shelter-in-place rules could lower the probability that encounters with random Californians would result in exposure to an infected person, neighboring states had much more lax regulations surrounding indoor dining, mask-wearing and other behaviors known to exacerbate the spread of COVID-19.
The Thanksgiving holiday may have been a massive, distributed super-spreader event where formerly disconnected family units spread between California and neighboring states intermingled. This multi-day exposure period introduced COVID-19 into California households who then spread it to other family members, acquaintances and coworkers. In essence, Thanksgiving broke California’s firewall.
I should pause now to reiterate that this is just speculation. The evidence I’m about to lay out is purely circumstantial and by virtue of this, can’t be used to establish a causal relationship. To show conclusively that interstate Thanksgiving travel was behind the December COVID-19 surge, one would need robust contact tracing data, geolocation history and test results from a wide swath of the populace–data that’s rightfully unavailable to the public. As such, I write these next paragraphs not to establish a claim, but perhaps inspire a line of inquiry for researchers with access to better data and with better training than myself.
With that said, for about the last 30 years, Californians have been steadily exiting the state. Since 2015, about 100,000 more people leave California every year than move to it. A large portion of those leaving are middle-to-lower class Californians unable to keep up with the state’s growing cost of living.
The latest U.S. Census data shows that Californians are mostly leaving for neighboring states. After Texas, which took in about 30,000 more people from California than it sent, Californians mostly decamped for Arizona, (net migration of 28,000), Nevada, (net migration of 23,000) and Oregon, (net migration of 20,000).

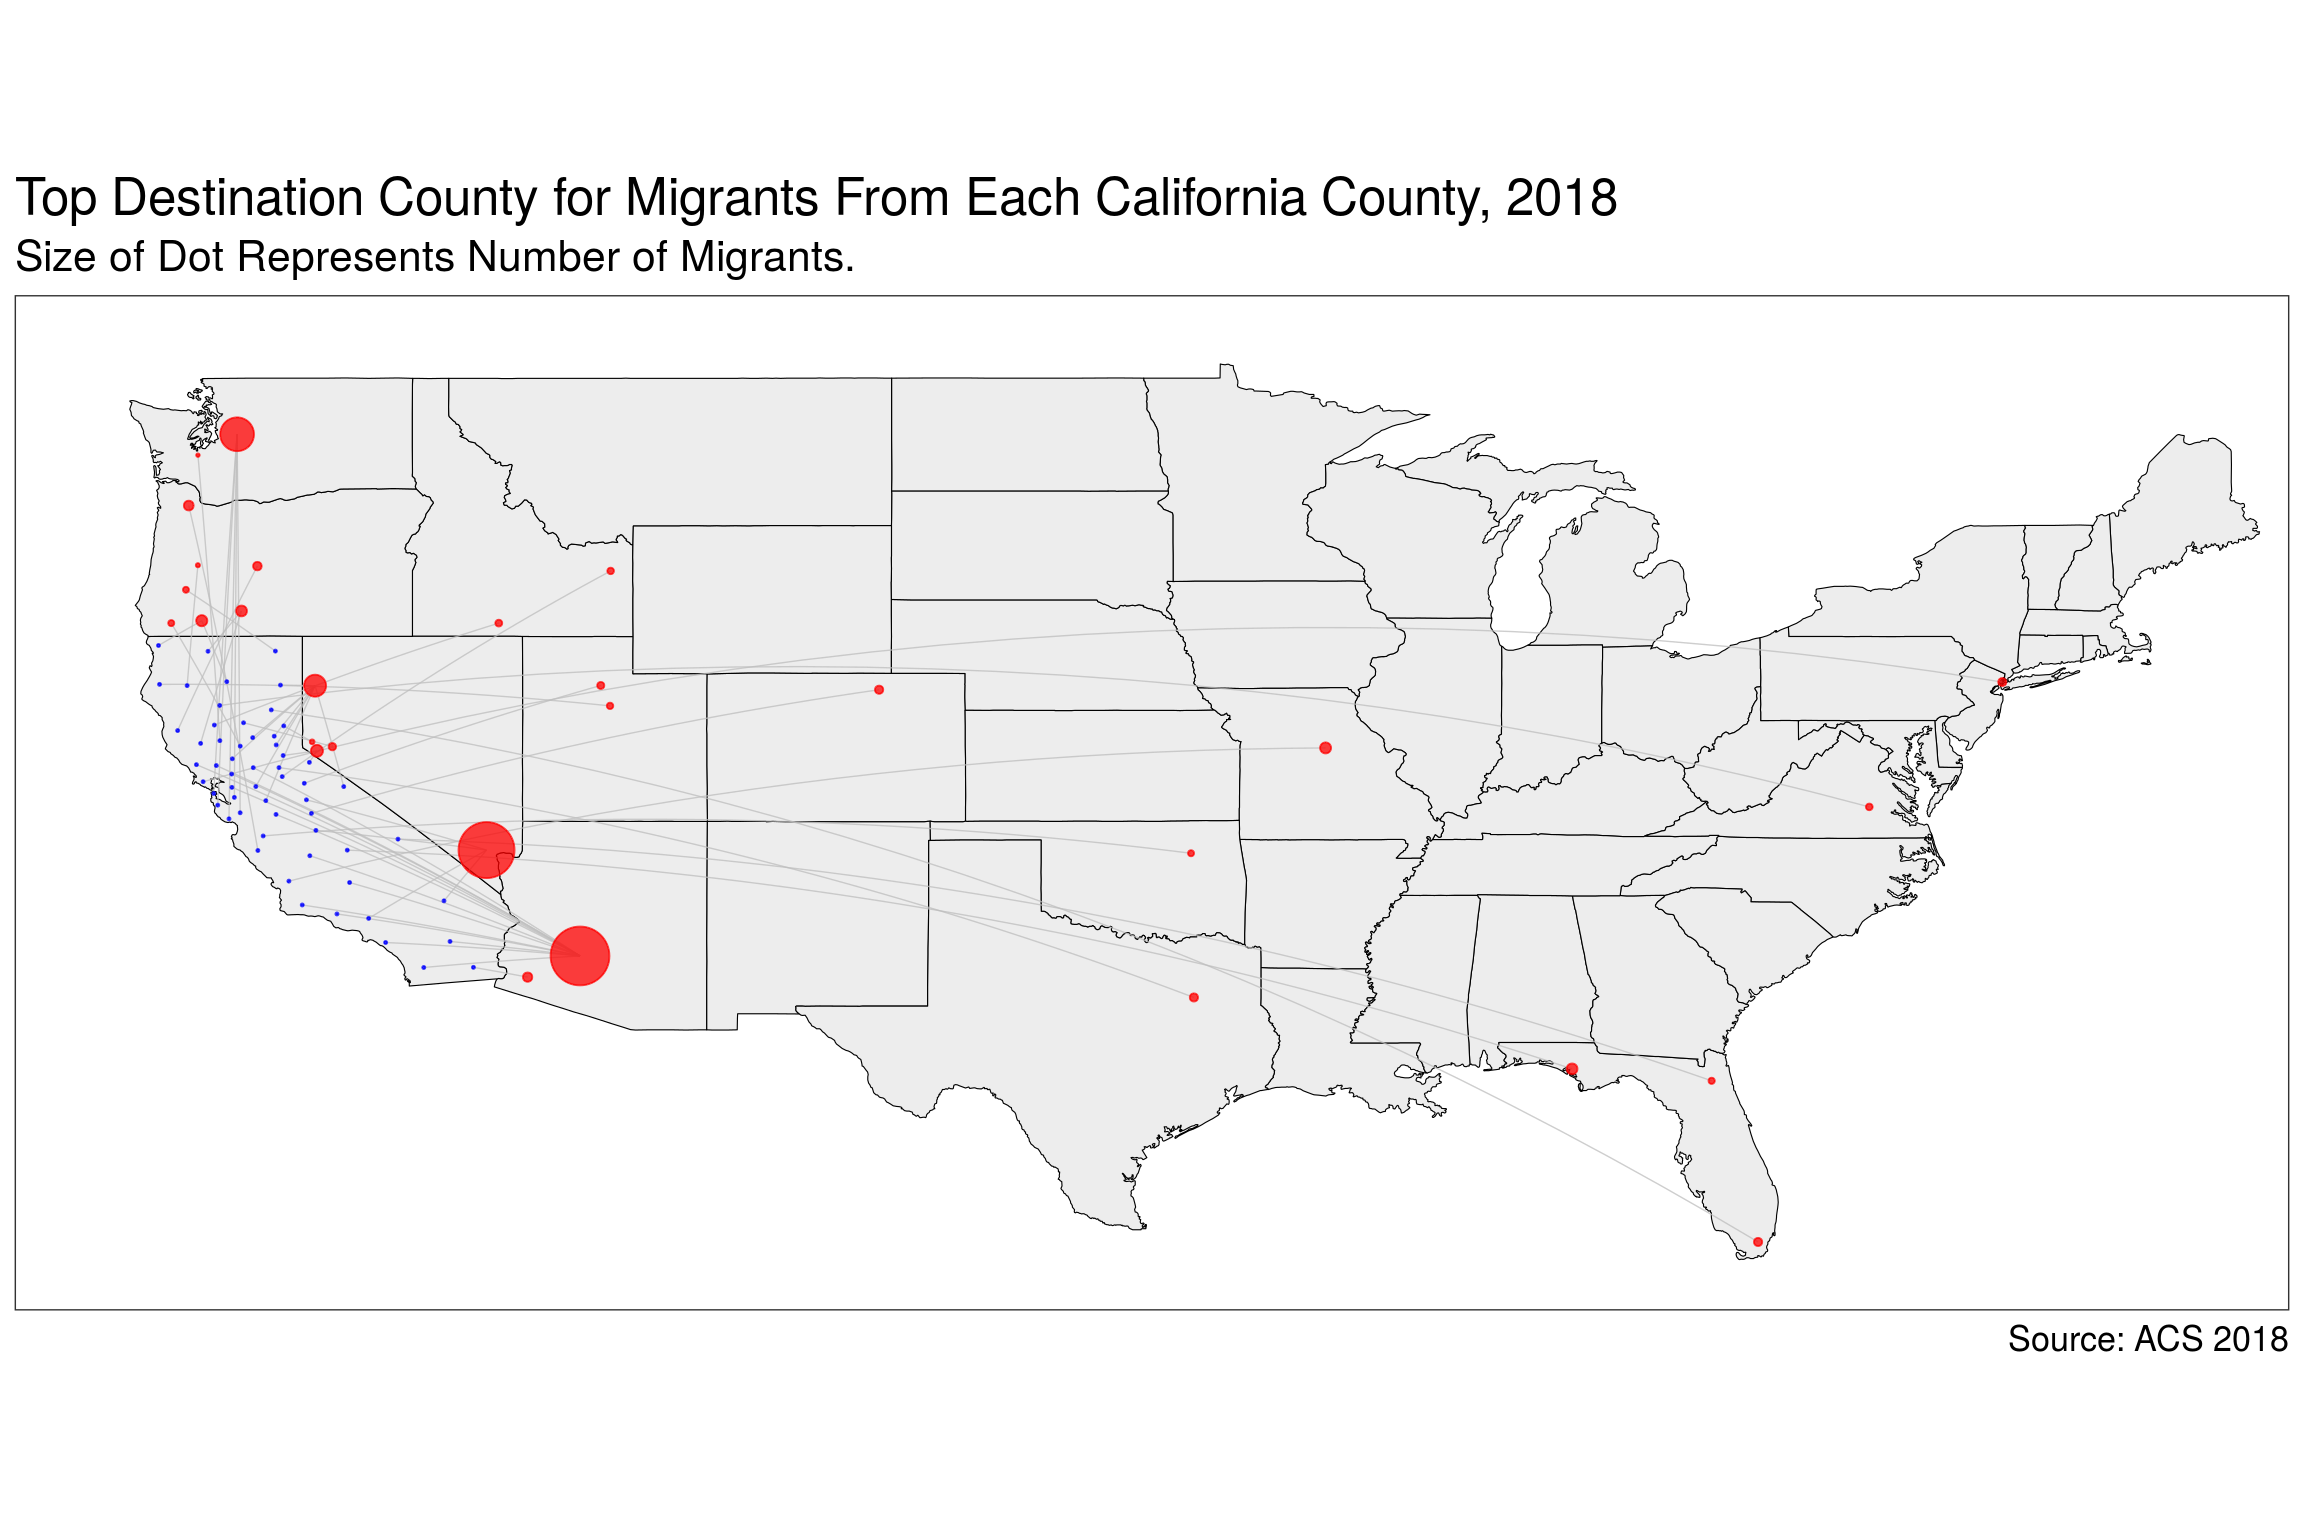
By far, the two most popular destinations for Californians leaving the state are Maricopa County, Ariz.–home to Phoenix–and Clark County, Nev.–home to Las Vegas. Those two counties received about 34,000 and 33,000 Californians in 2018 alone. However, different parts of California are emigrating to different places when they choose to leave the state. As the above figure shows, King County, Washington is the top choice for people leaving the counties of the San Francisco Bay Area while people from Southern California and the Central Valley head to the Phoenix and Las Vegas areas as their top destination.
These three states–Arizona, Nevada and Washington–had vastly different experiences with COVID-19 this winter. As in California, case incidence began spiking in Arizona, Nevada and Washington in the weeks leading up to Thanksgiving. However, unlike in Arizona and Nevada, Washington was able to bend the curve back following the Thanksgiving holiday. The other two states as well as California saw tremendous surges post Thanksgiving which are just now beginning to abate. Most remarkable however, is that daily case counts in Washington and California were roughly equivalent in the weeks leading up to Thanksgiving. A few days after, they began to diverge drastically.
Moreover, both the Las Vegas and Phoenix areas were experiencing COVID-19 surges during November. Phoenix broke it’s previous record on case growth during that month, a record that was unfortunately broken again in December and then again in January. Nevada broke its statewide record on Nov. 23 with about 2,900 new cases–with a lion’s share of new cases coming from the Las Vegas area.

Examining the average daily death county provides an even more striking picture. While more lax testing regimes can artificially depress case counts below what their true number should be, COVID-19 fatalities provide a more stable, if not grimmer, picture of the disease’s prevalence in a given area. Looking at Los Angeles County in relation to Maricopa and Clark Counties, the higher daily death-rate in both prior to Thanksgiving would indicate a higher prevalence of COVID-19 infections in those areas. Most interestingly, the death rate in Los Angeles County began spiking around December 20, about 25 days after Thanksgiving and about the time the average person would succumb after being exposed to the coronavirus on that holiday.

Using data from Smart Thermometers, some have shown a linkage between travel to the Las Vegas area in early December and increased fevers in subsequent weeks. Using that same anonymized cell-phone location data provided by SafeGraph, I can also see if Californians traveled more to the COVID-19 rich Phoenix and Las Vegas areas over the Thanksgiving holiday week compared to previous and subsequent weeks. Likewise, I can also see if people from those areas traveled into California, perhaps reuniting with family members still in that state.
A preliminary exploration of interactions shows a small and statistically significant positive correlation between the number of Californians who migrated to a state in 2018 and the increase in Californians visiting that state over this year’s Thanksgiving holiday as well as people from that state visiting California. Specifically, a one percent increase in the number of Californians moving to that state in 2018 correlated with about a 0.003 percentage point increase in interactions between Californians and those of that state over Thanksgiving week relative to the weeks immediately before and after. Though other factors are likely influencing both variables, (e.g. proximity to California), there’s at least some relationship between the two.
With SafeGraph’s data, I can examine weekly visitor data for thousands of non-airport locations across Clark County, Nevada, Maricopa County, Arizona and several regions of California. Other scholars have used SafeGraph data to examine events such as the invasion of the U.S. Capitol on January 6th of this year and to track the spread of COVID-19 from that insurrection. Nationally, SafeGraph collects data on about 3.6 million points of interest.
With this data, I can compute what proportion of visitors to each location had a home address either inside or outside California. From this, I can the estimate the average proportion of visitors to Maricopa and Clark Counties from California as well as 95% confidence intervals around this estimate for the week of Thanksgiving as well as the weeks immediately before and after. Importantly, if the error bars around the weekly estimates don’t intersect, it’s unlikely that the difference is occurring by pure chance.

First, we see an influx of visitors from both Maricopa and Clark Counties during Thanksgiving week to all regions of California. However, this might not be indicative of anything more than California being a popular tourist destination. The largest proportion of any of these out-of-state visitors to any region of California were people from Maricopa County, AZ visiting San Diego–which has long been a popular tourist destination for those from the Phoenix area, (ask any San Diegan about “zonies.”)

However, looking at Californians who traveled to both of these counties provides a more interesting picture of Thanksgiving week travel. For all regions of California except the Greater Los Angeles area, there was no significant distinction in the number of people visiting the Las Vegas area over Thanksgiving week. Those from the LA region, on the other hand, represented over two percent of visitors to locations in Clark County, Nevada tracked by SafeGraph. Further, while Californians from the Bay Area and San Diego area also visited the Phoenix area at significantly different rates over Thanksgiving week, those from the Greater LA area represented a far greater proportion of visitors in those two areas.
Again, this is far from an unassailable monocausal explanation for the tragic events that overtook Southern California in recent months. Like with all things involving a rapidly evolving virus raging through a country with inadequate public health resources, efforts to reduce the cause of any given outbreak to a single factor are little more than sophistry. While the coronavirus is itself a complex organism, the whole of American society is even more so.
That being said, California’s experience with COVID-19 has spotlighted the many deficiencies in our state’s status quo. Housing–the area that we at California YIMBY dedicate our efforts to fixing–has shown itself to be a catalyst for the disease’s spread as it ravaged the crowded household’s of the state’s poor. What the data I just laid out suggests is that California’s housing crisis might not just be the fuel that helped the flames of the pandemic burn hotter, it might have also been one of the sparks that ignited it.